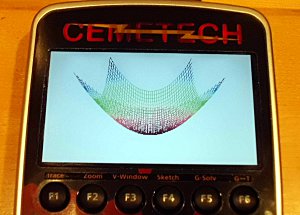
Following a proud tradition of doing ridiculous things because we can, Cemetech's latest side-side-side project will do something a bit more useful. Long have I yearned for a beautiful 3D graph add-in to accompany the beautiful, high-resolution color screen on my trusty Casio Prizm calculator. Unfortunately, issues such as time constraints and no system calls that hook Casio's CAS have prevented this from becoming a reality. That changed a few months ago when Cemetech user AHelper, well-known for his upcoming GlassOS third-party TI-84+ operating system, decided to release source and information about his gCAS2 library. This nifty set of functions and support routines turns a string holding an equation into an AST (a tree representing the equation) and can then produce a numerical answer. It's currently still somewhat limited, and I tracked down a number of errors, but with that plus some custom color-mapping and 3D rendering code of my own, I produced a program that can graph any 3D equation.
Of course, it is still quite rudimentary. Although I've begun a single-line text input routine for entering equations, currently the equation to be graphed is compiled into the program (although it still calculates all points and colors on-the-fly on the Prizm!). Things like an adjustable window and zoom and rotation are coming soon, although I have a good idea of how they'll work. Trig functions including sin, cos, and tan are not yet in gCAS2, and there are glitches with certain types of coefficients. Nevertheless, as I find time, I hope to gradually bring this to an educational-grade, very useful 3D graphing program!
As always, feedback, comments, and suggestions are welcome. And don't forget that if you pre-order my upcoming beginner programming / TI-BASIC book, Programming the TI-83+/84+ before March 6th, there's a 50% off code, "TI8384".
The following is a graph of Z=((X*X+Y*Y)/4)-5;


