With Earth Impact! from TI Education's STEM Behind Hollywood program released and tested by TI Education president Peter Balyta himself, it was only a matter of time before I gave the remaining activities in the now five-part series a try. Zombie Apocalypse was the first in the series, released to widespread acclaim from TI-Nspire-using teachers. I'm excited to bring this activity to teachers and students who use the TI-84 Plus C Silver Edition calculators in their classroom, and as always, I'll be keeping this topic updated while I develop this new activity.
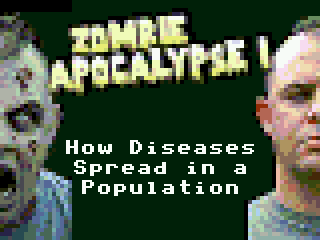
Wait... I didnt know this was a thing! So this new program will be used to teach how diseases spread in a population?
That's right! You can read about the original activity on TI Education's website. It has become particularly timely as people seem increasingly paranoid about the threat of an ebola outbreak, and in fact would help put that in perspective. It teaches what different parts of the brain do, what virulence of a disease means for how it spreads, and a few other things.
Hey awesome! Have you had a chance to experiment with 32colour images? I can convert if you need.

Also, are you getting paid for this lol?
tr1p1ea wrote:
Hey awesome! Have you had a chance to experiment with 32colour images? I can convert if you need.

Also, are you getting paid for this 0x5?
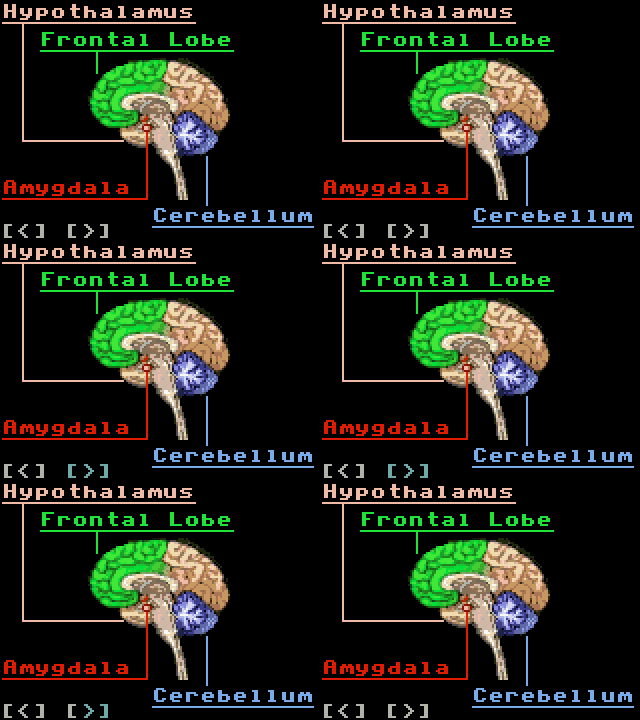
No, I'm not getting paid for this; maybe I should be. Wink I can't use the 32-color images, even though Tokens does the conversion, because my method of packing requires copying images out to RAM before displaying them. And unfortunately, 12KB of RAM is dear when you have 23KB to start with and a 5-8KB TI-BASIC program and some text in strings as well. I have to stick with the ~5KB low-res backgrounds for now, sadly.

Edit: I worked on a lot of the content today, but I don't want to give it all away, so here's a sample:

Wow! It really is amazing the added detail that colour can add Smile.
Looking awesome! Are you essentially just using the core of the Earth Impact engine, and adding in the data for this?
tifreak8x wrote:
Looking awesome! Are you essentially just using the core of the Earth Impact engine, and adding in the data for this?
No, it's much more complicated than that, since the graph modes are different, the simulation is completely different, and there are different special image + text pages (like the one above). Pretty much the only thing I'm reusing the paging system and the event handler.

tr1p1ea wrote:
Wow! It really is amazing the added detail that colour can add Smile.
Definitely agreed! And xLIBC makes it much easier to harness the color than the built-in TI-BASIC tools. Wink
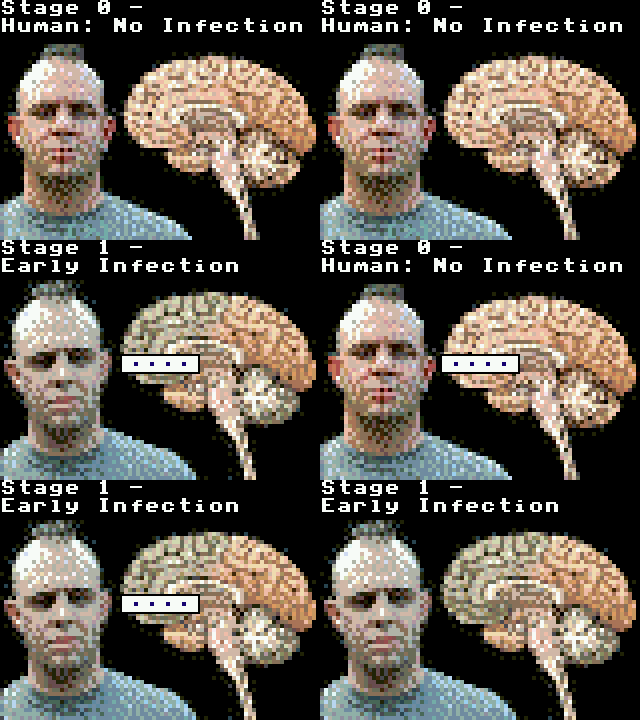
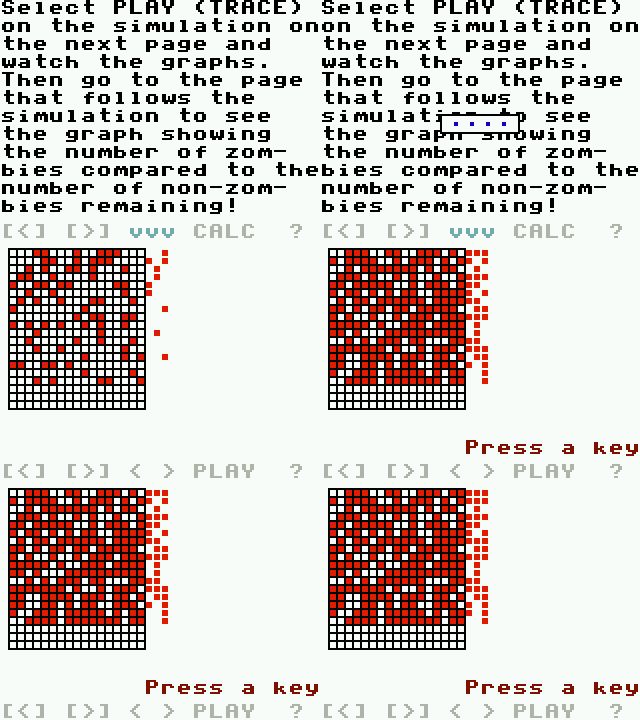
*bump* I put this aside for a few days due to other projects, including my actual work work that I get paid to do, but I'm back to it now. The biggest problem I'm currently encountering is speed of pulling out xLIBC backgrounds deep within the data file. I solved this by writing an assembly program that copies directly from a given offset (in Ans, divided by 8, since the upper limit for _ConvOP1 is 9999) in bytes into an archived AppVar into a RAM AppVar, which xLIBC can then use directly. This saves the lag associated with Celtic II CSE searching for newline characters to find the data I've packed in. Of course, this could also be solved by Celtic II CSE having a function to copy M bytes at offset N in a given file into a string, something I hope to include in a future release. Also, this program is stored within the data AppVar as binary, and is unpacked into a new assembly program when the activity starts. The upshot is that flipping between these pages is fast:


Ooo~ Hooray for future Celtic libraries Very Happy would be a good one to have for sure!

And this looks good so far. Glad to see you're back at the grind with this thing Smile
tifreak8x wrote:
Ooo~ Hooray for future Celtic libraries Very Happy would be a good one to have for sure!
Thanks; I'm planning to add that one as soon as possible so I don't forget about it.

Quote:
And this looks good so far. Glad to see you're back at the grind with this thing Smile
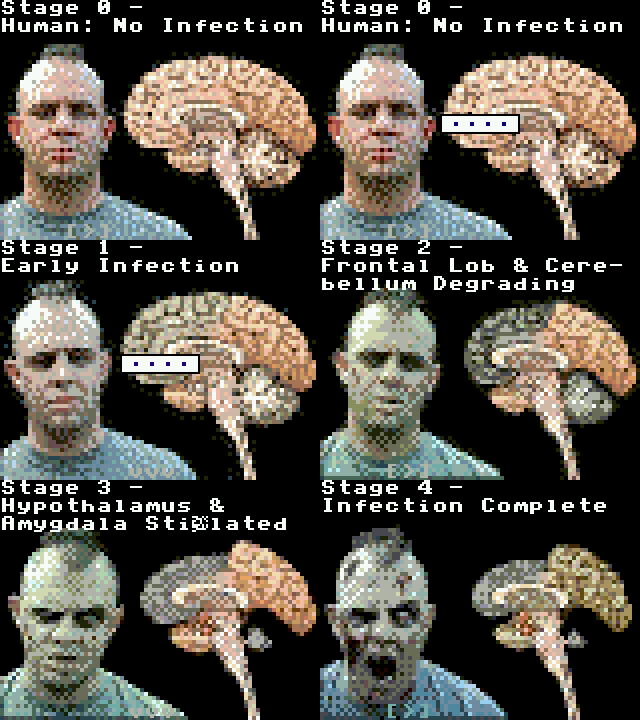
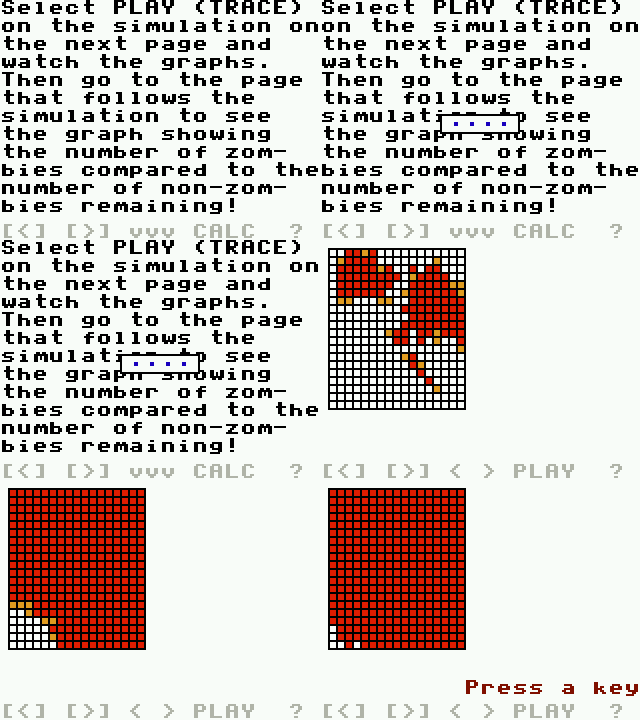
Yep, I'm trying to thread it in between my other work, although life stuff in the next few days will necessarily limit my progress. In the meantime, I added all the stages of the zombie virus infection:

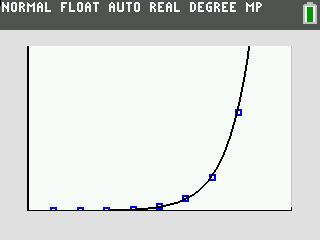
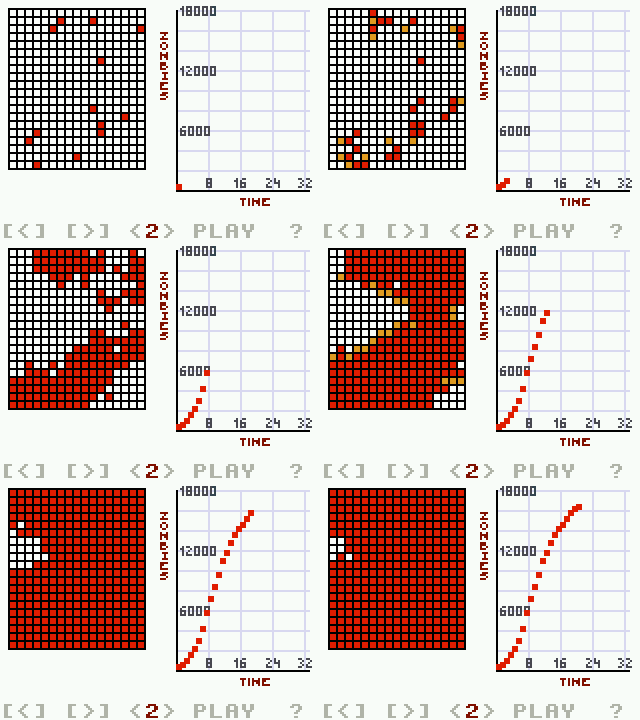
*bump* I modified my ASM subprogram to accept a length argument in variable X, so that the 384-byte larger (5191 byte) 72x72-pixel sprite used for the labelled picture of the brain can be copied out the same way as the full-screen backgrounds. Now that brain page is drawn much faster. I also worked on reverse-engineering the equations used for drawing the spread of the Zombie Virus in a population. I entered the data points as (week vs. infected individuals) in L1 and L2, then tried a bunch of regressions on my TI-84+CSE. The closest possibility appeared to be an exponential regression, in the form y=a*b^x. Unfortunately, I couldn't quite get the fit right, so I tried deriving the equation logically:

Code:
t0: p0 = 1                    // Initial infected population at t0
t1: p1 = p0 + v*p0 = p0(1+v)  // Average spread is v (virulence) per infected host
t2: p2 = p1 + v*p1 = p1(1+v) = p0(1+v)^2
tn: pn = p0(1+v)^n
And lo and behold, a perfect fit for v=2, yielding Y1=1(1+2)^X:


Oddly enough, TI's version doesn't mention this equation anywhere. I'll probably try to put it into the Teacher Notes so that teachers can explain this derivation to interested students.
Definitely glad you are taking care of these, I doubt I'd have been able to figure out the equation stuff myself.

Things are looking good and I'm looking forward to running this on my CSE to test. Smile
tifreak8x wrote:
Definitely glad you are taking care of these, I doubt I'd have been able to figure out the equation stuff myself.
Thanks. Smile I remain surprised that neither the student nor teacher handout specifies the exact equation used for the graphs.
Quote:
Things are looking good and I'm looking forward to running this on my CSE to test. Smile
I appreciate it! In fact, I finished delineating all of the text (that is, adding manual line breaks) during a long bus ride yesterday, and I resolved several bugs during the weekly HCWP session last night. The remaining item before finishing the handouts and giving the final product to you guys to beta-test is the simulation and graph on pages 24 and 25 respectively, which I'm working on now. Wish me luck!

Edit: I'm working on the simulator, and I just want to document my attempts to convert a number N between 1 to 8 to an (X,Y) offset to a matrix element around some element (B, A). In other words, 1 should be above and left, 2 directly above, 3 above and right, 4 directly left, etc.

Offset D = X offset:
If N={1 or 4 or 6}, D=-1
If N={2 or 7}, D=0
If N={3 or 5 or 8}, D=1

Offset C = Y offset:
If N={1 or 2 or 3}, C=-1
If N={4 or 5}, C=0
If N={6 or 7 or 8}, C=1

Good:
(N>=6)-(N<=3->C (10 bytes)
remainder(N+(N>4),3)-2->D

Better:
int(N/3)-1->C (7 bytes)
remainder(N+(N>4),3)-2->D

Edit #2: The first pass at making an optimized, sufficiently fast simulator works, but is way, way too slow. I'm seriously considering using a little ASM stub to quickly determine which matrix elements to "infect" next. On the plus side, it looks nice.

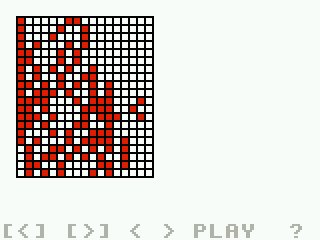
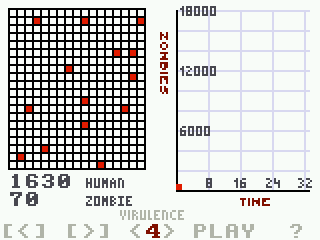
*bump* I wrote about 75% of an assembly program to assist with the simulation. It has two modes: setting up the initial field of zombies, and executing one step of the simulation in which humans are converted to zombies according to some virulence value. I have completed all of the first mode and most of the second mode; the remaining missing feature is determining the correct place to put a new zombie when it is determined that one has infected a human. I also may consider adding a third mode that draws infected humans in orange and then swaps them to red when they turn into zombies, as the original activity does. Then I'll need to graph and store the data. Quick demo of the speed (which is about 100x faster than the original BASIC solution):

Wow, that looks impressive! And quite speedy! Are the blocks outside the grid on purpose, or a glitch?
tifreak8x wrote:
Wow, that looks impressive! And quite speedy! Are the blocks outside the grid on purpose, or a glitch?
That was due to an unfortunate copy-paste error. I have since repaired it. Smile

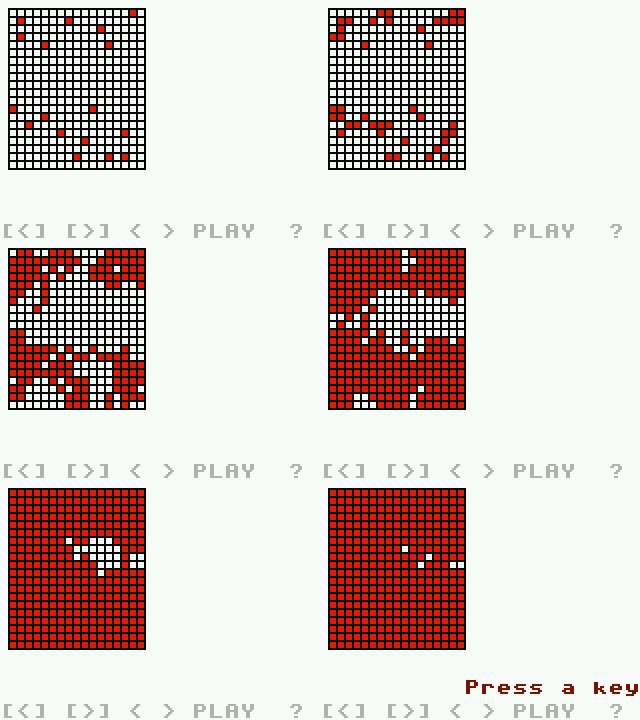
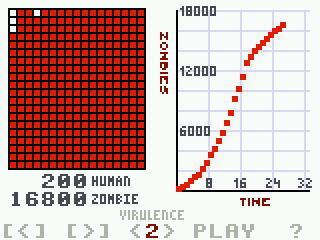
Edit: And after a night and morning of work, it works! Unfortunately (and definitely a #firstworldproblem), it runs too fast (left screenshot). I used rand(5 twice per simulation step to slow it down slightly (right screenshot). Next up is the graph.

Ha ! That reminds me of the same situation, If you look at the Nspire Lua code in the original activity you'll see I set the timer period at 0.5s (contrary to some lower value, initially) as it would be too fast to properly see things happening Razz
But yeah, since this is Lua, we can just change the period, not having to actually "do something" to make it wait (I remember using "69!" in Basic to slow stuff down when I was still coding on my 84...)

Edit : indeed, it's odd that they didn't mention the equation. They did talk about it at the T3 conference, though. Meh...

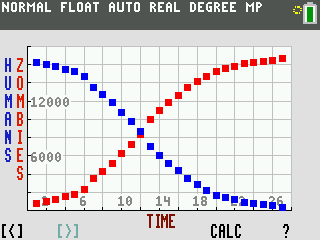
Also, on the Nspire, it's actually pretty simple to get the regression (it can also make it in real time as the points gets added, but that has limited interest...).
For the one you posted about earlier, indeed we get a simple exponential law, and for the one in the "S curve" as they like to call it, it fits a logistic regression well (but I doubt that's for High School students) :
adriweb wrote:
Ha ! That reminds me of the same situation, If you look at the Nspire Lua code in the original activity you'll see I set the timer period at 0.5s (contrary to some lower value, initially) as it would be too fast to properly see things happening Razz
But yeah, since this is Lua, we can just change the period, not having to actually "do something" to make it wait (I remember using "69!" in Basic to slow stuff down when I was still coding on my 84...)
I use the rand(X) trick as a delay; it works quite well.

Quote:
Edit : indeed, it's odd that they didn't mention the equation. They did talk about it at the T3 conference, though. Meh...
And I presume it matches the equation that I deduced for it?

Quote:
Also, on the Nspire, it's actually pretty simple to get the regression (it can also make it in real time as the points gets added, but that has limited interest...).
For the one you posted about earlier, indeed we get a simple exponential law, and for the one in the "S curve" as they like to call it, it fits a logistic regression well (but I doubt that's for High School students) :
Indeed, I plan to mention that in the teacher notes, but I think it would just confuse students. Because of the way I store the data, I could compute that logistic regression, but I'll save that as an exercise for the reader.

Today I've been working on the graph.


Edit: Now there are human and zombie counts and a Virulence label on the virulence value, but the code for displaying the counts doesn't update, and the values are 10x too small. To do:
[ ] Make ASM program output infected count during phase 1, not phase 2
[ ] Make counts erase and update during simulation
[ ] Make counts right-aligned and pad with extra 0
[ ] Fix (nerf?) effect of virulence value
[ ] Add state to have simulation in pre-play or post-play mode
[ ] Fix updating entire screen on virulence change


Edit #2: I did much of that. The current state of affairs:
[X] Make ASM program output infected count during phase 1, not phase 2
[X] Make counts erase and update during simulation
[X] Make counts right-aligned and pad with extra 0
[X] Fix (nerf?) effect of virulence value
[ ] Add state to have simulation in pre-play or post-play mode
[ ] Fix updating entire screen on virulence change
[ ] Implement graph after simulation


Edit #3: I did most of that. The current state of affairs:
[ ] Add state to have simulation in pre-play or post-play mode
[X] Fix updating entire screen on virulence change
[X] Implement graph after simulation


Edit #4: Finished that state thing as well, and I updated the help. I think the only thing left to do in the morning is see if there's a way to put the page number on every page, then get back to writing the documentation so I can release a beta.
*bump* I have released a beta of the Zombie Apocalypse Part 1 activity for the TI-84 Plus C Silver Edition. I humbly request your help, TI-84+CSE-owning reader, to check over the student and teacher handout PDFs and try doing the activity yourself. Thanks in advance!

Download
[Beta] Zombie Apocalypse Part 1 Activity for TI-84 Plus C Silver Edition

  
Register to Join the Conversation
Have your own thoughts to add to this or any other topic? Want to ask a question, offer a suggestion, share your own programs and projects, upload a file to the file archives, get help with calculator and computer programming, or simply chat with like-minded coders and tech and calculator enthusiasts via the site-wide AJAX SAX widget? Registration for a free Cemetech account only takes a minute.

» Go to Registration page
Page 1 of 2
» All times are UTC - 5 Hours
 
You cannot post new topics in this forum
You cannot reply to topics in this forum
You cannot edit your posts in this forum
You cannot delete your posts in this forum
You cannot vote in polls in this forum


Advertisement